
Seeing Under the Cedar: Canopy Height & Bare Earth
A regular photo map sees the tops of things — the canopy of a cedar brake, the crown of a live oak, the brush along a fence line. It can't see the dirt underneath. On Hill Country land, where cedar and brush hide the ground, that's a real problem for anything about terrain, drainage, or volumes. This is exactly what a LiDAR scan solves.
Two surfaces, not one
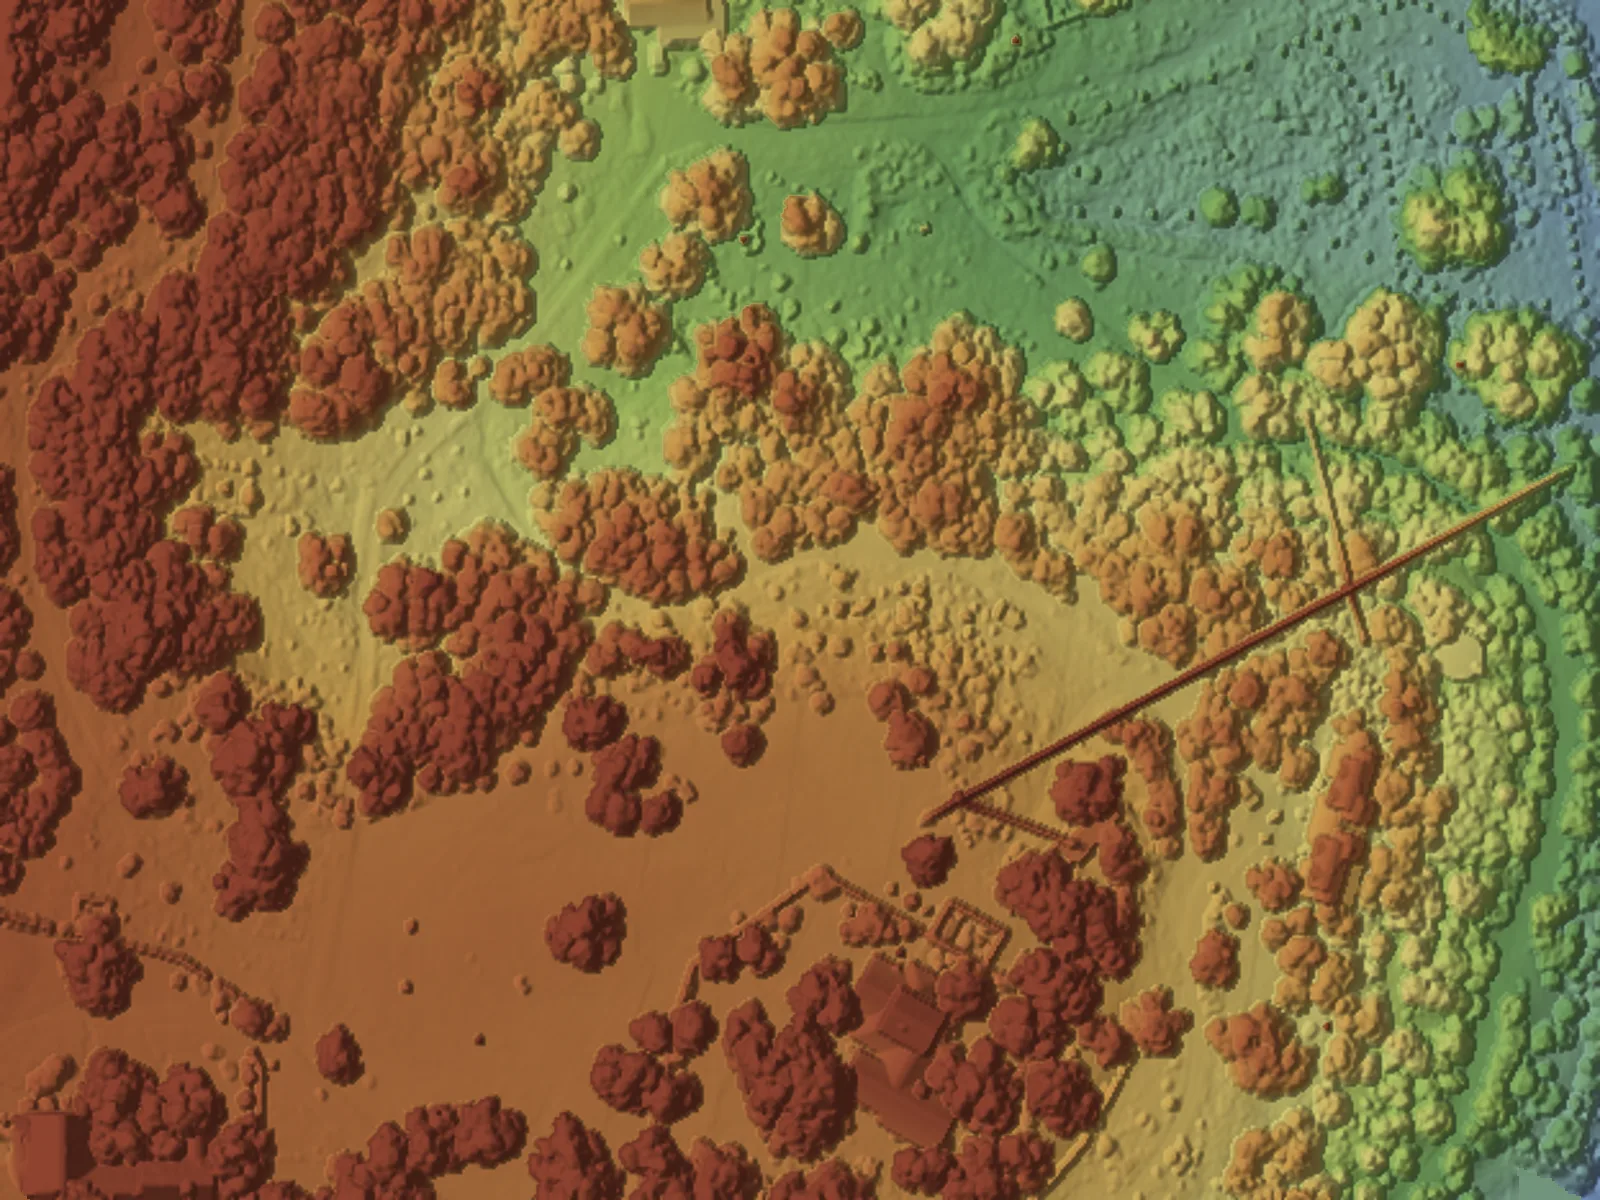
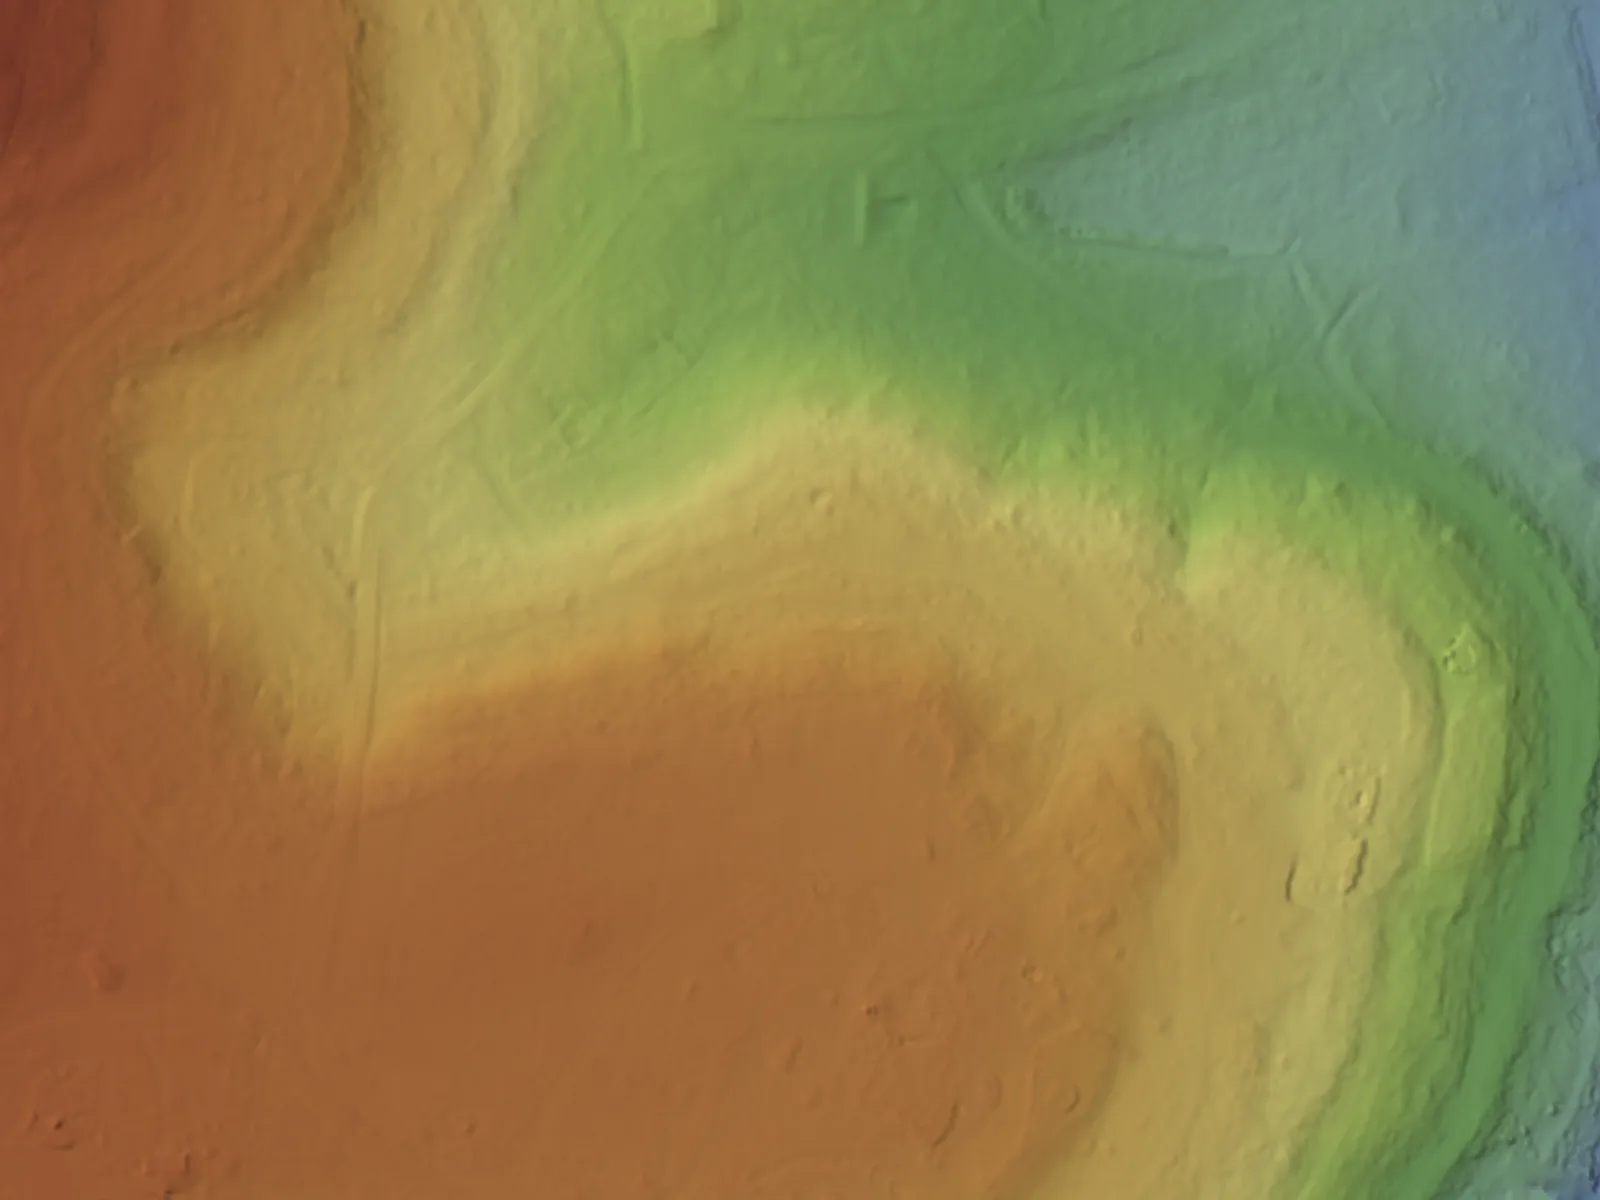
LiDAR fires laser pulses that slip through gaps in foliage and bounce off whatever they hit — some off leaves and branches, some all the way down to the ground. That lets us build two different surfaces from the same scan:
- DSM — Digital Surface Model: the top surface, following the treetops, brush, and rooftops. It's what things look like from above.
- DTM — Digital Terrain Model: the bare earth, with vegetation and structures stripped away, so you're looking at the actual ground the way it would be if you mowed the whole property flat to the dirt.
The DTM is the surface every terrain and drainage layer is built on — hillshade, slope, contours, flow, and TWI all come from bare earth (see Reading Your Terrain Layers and Where the Water Goes). Without LiDAR seeing under the canopy, those layers would be following the treetops instead of the ground, and the drainage story would be wrong.
The Canopy Height Model (CHM)
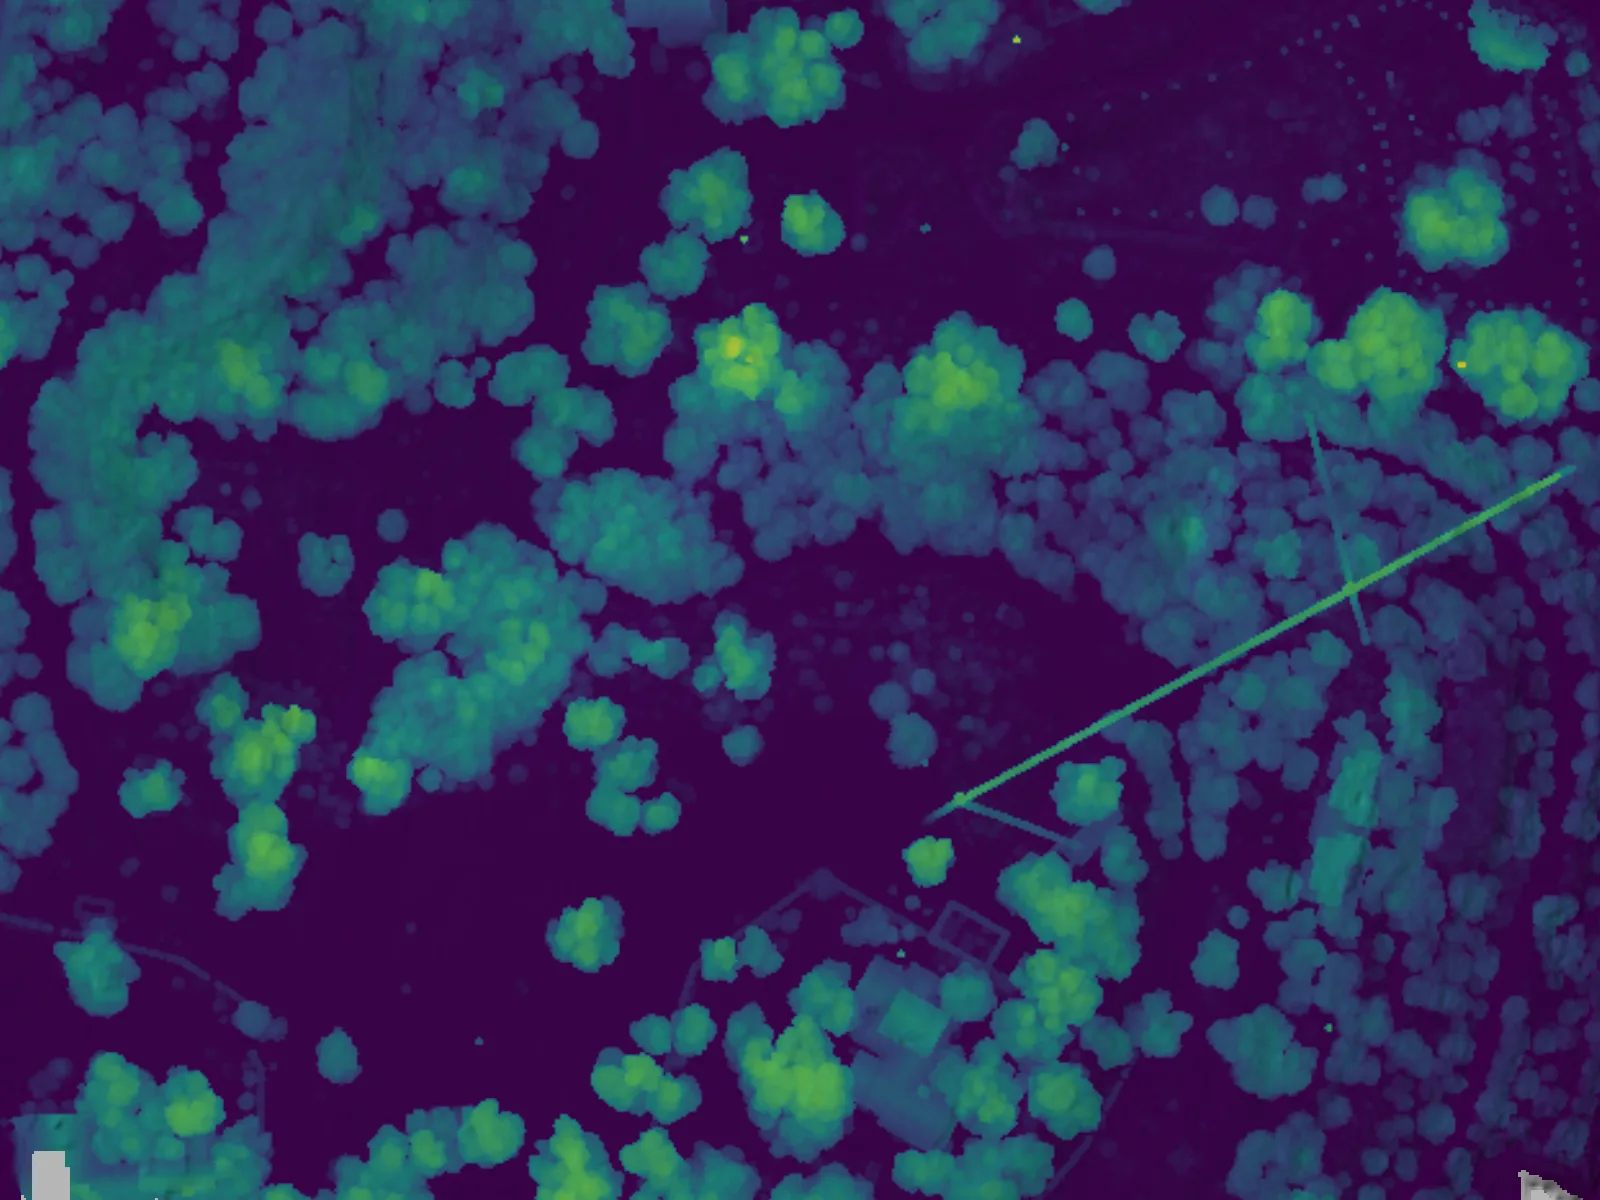
What it is: subtract the bare earth (DTM) from the top surface (DSM) and what's left is the height of everything growing on the ground — the vegetation, cell by cell. That's the Canopy Height Model. It reads as a map of how tall the brush and trees are: near zero over open pasture, low over young cedar, tall under a mature oak motte.
When to use it:
- Brush and cedar management — see where the heavy canopy is, estimate what a clearing job involves, and measure the change after you clear (fly it again and compare).
- Fuel load and fire planning — tall, dense canopy near structures is exactly what you want to find and map.
- Habitat and pasture planning — distinguish open grazing land from brushed-in acreage at a glance.
- Trusting your terrain data — the CHM is the visible proof the LiDAR separated canopy from ground, so you know the bare-earth layers underneath are real.
Why it beats a photo map
A photo-based elevation model drapes over the top of the brush — it literally can't measure the ground it can't see. LiDAR's ability to punch through canopy gaps is what makes the bare-earth surface, and everything derived from it, honest on wooded land. If your property has meaningful tree or brush cover and you care about terrain, drainage, or volumes, make sure a LiDAR scan is in your package (see Point Cloud (LiDAR)).
The honest limit
Canopy height and bare-earth surfaces are computed from your elevation data the same way the terrain layers are, and they carry the same limit. Drainage, flow, terrain, and floodplain layers are derived analysis computed from our elevation data to support planning and design. They are not a certified survey, a stamped engineering study, or a FEMA flood-zone determination. They're precise mapping, excellent for land management and planning — but Embry Solutions does not perform land surveys. For boundary or title work, consult a licensed Texas surveyor.
Related guides
Point Cloud (LiDAR) — millions of measured 3D points
A dense cloud of individually measured 3D points describing your site's exact shape. Ideal for precise elevations, seeing the bare ground beneath vegetation, and detailed terrain and structure analysis.
Reading Your Terrain Layers (Hillshade, Slope, Aspect, Contours)
The four terrain layers we derive from your elevation model — hillshade, slope, aspect, and contours — what each one shows, and when to reach for it for grading, drainage, siting, and access planning.
Where the Water Goes: Drainage, Flow & Wetness (TWI)
Flow accumulation, the Strahler drainage network, and the Topographic Wetness Index in plain English — how we model where water collects, channels, and lingers on your property from the shape of the ground.
Didn't find your answer? Contact us and we'll help you out.