
Reading Your Terrain Layers
Once we have an accurate elevation model of your property, we can derive a family of terrain layers from it — each one a different way of looking at the shape of the land. They all come from the same bare-earth surface, so they line up perfectly on top of your 2D map. Here's what each layer shows and when to use it.
Where these come from
Every one of these layers is computed from your bare-earth elevation model (the ground surface, with buildings and vegetation removed). LiDAR is what makes that bare-earth surface trustworthy under tree cover — see Seeing Under the Cedar for why. Once we have the surface, the terrain layers below fall out of it as different readings of slope and shape.
Hillshade (shaded relief)
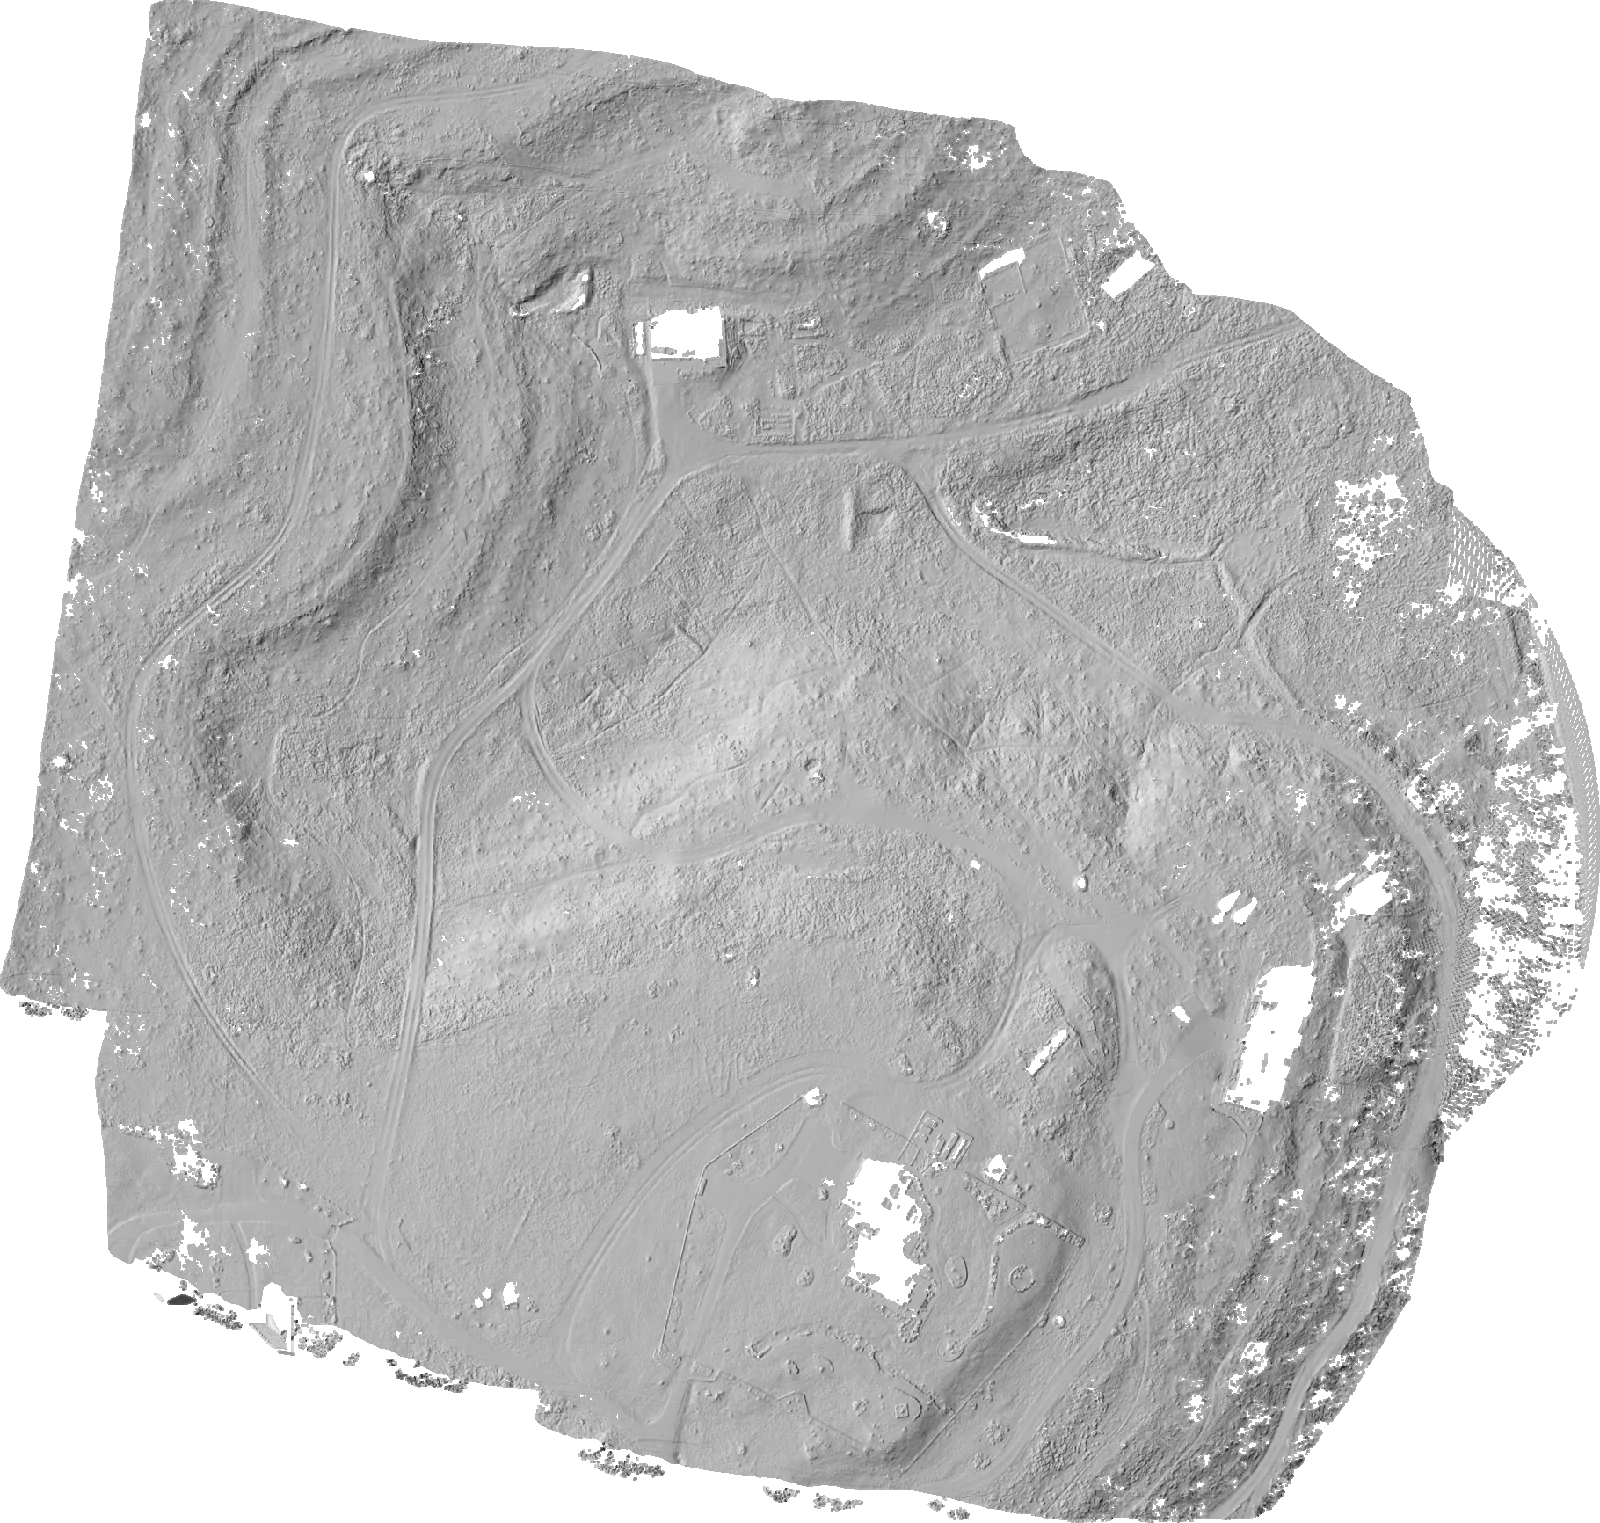
What it is: a grayscale rendering that lights the bare ground from a low, angled "sun," so ridges, gullies, benches, old terraces, and drainage cuts pop into relief the way they would at golden hour — but with buildings and brush stripped away.
When to use it: getting oriented fast. Hillshade is the most intuitive terrain layer — you can see the lay of the land at a glance, spot where water would run, and find subtle features (an old channel, a filled tank, a two-track road) that a flat color map hides. It's the base layer we drape the drainage analysis over.
Slope (steepness)
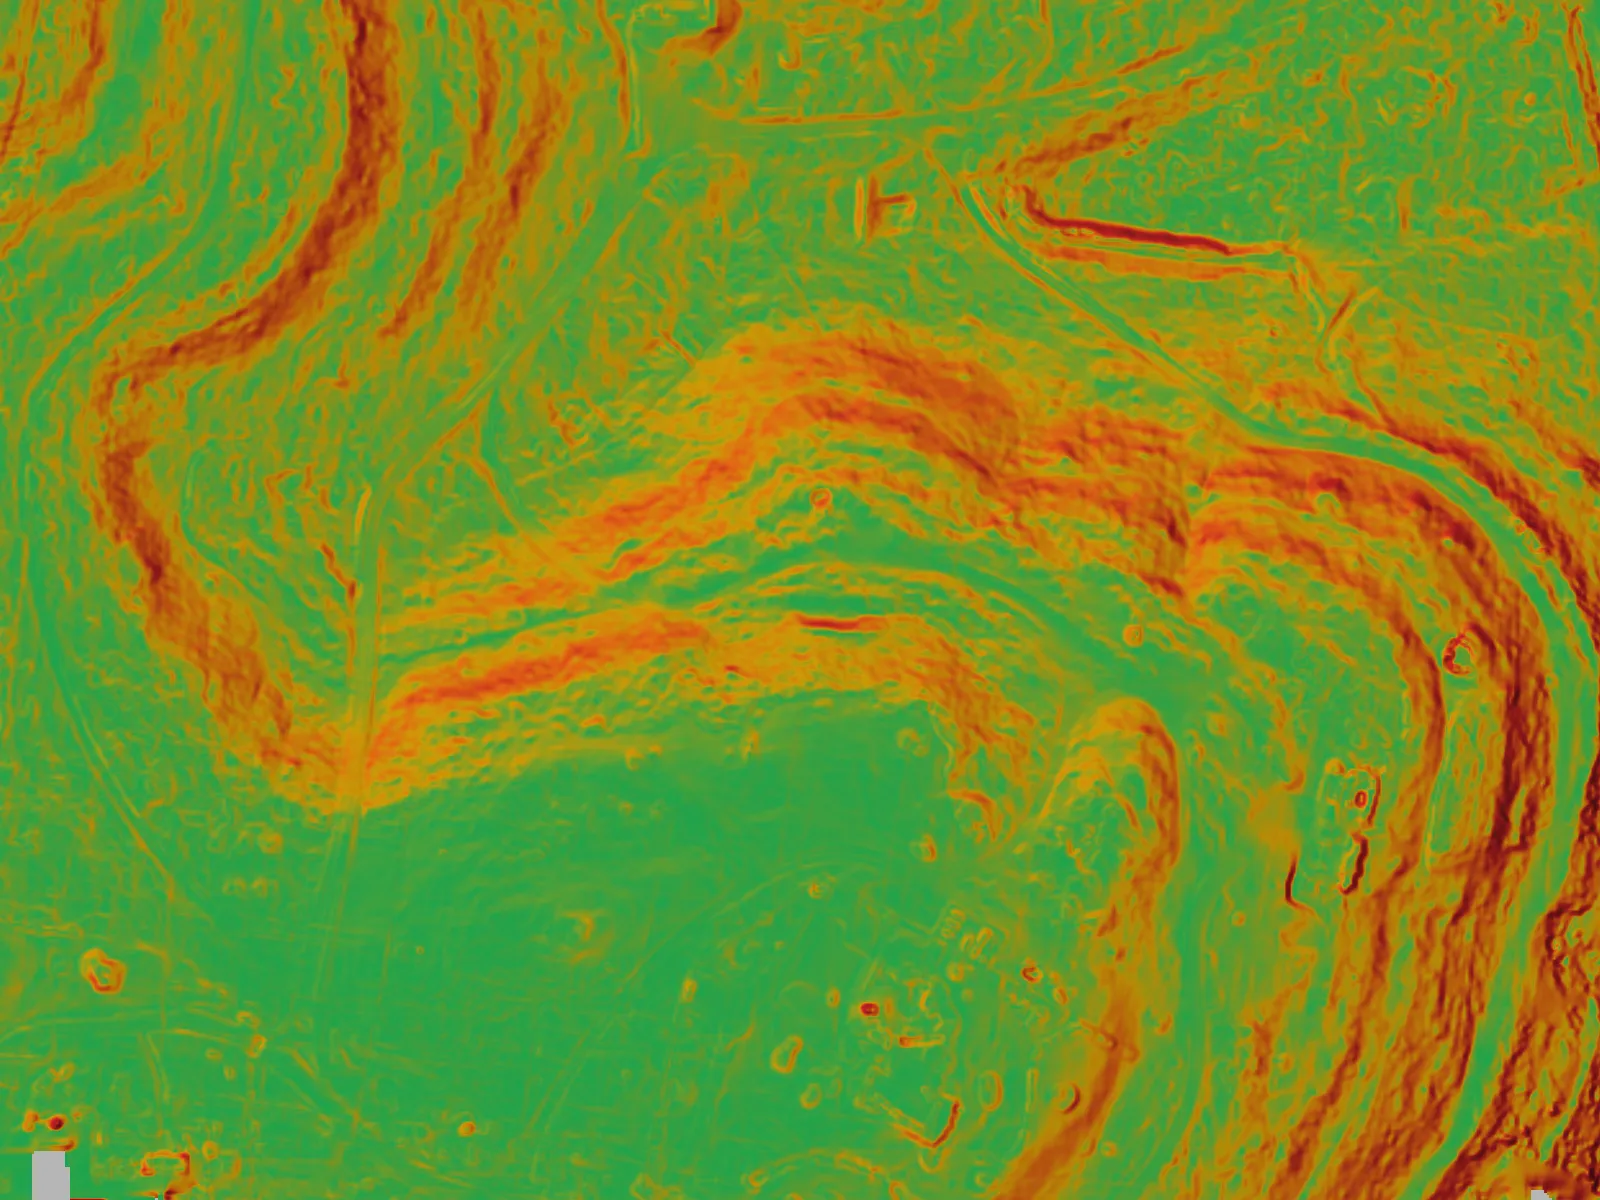
What it is: a color map of how steep each spot is — greens and blues for gentle ground, warming to oranges and reds where the grade gets aggressive. It answers "how hard does this fall away?" cell by cell.
When to use it: siting and grading. Slope tells you where a pad, road, pond, or building will sit comfortably and where you're fighting the land. It flags erosion-prone faces, cut-and-fill headaches, and access limits for equipment before you ever stake anything.
Aspect (which way a slope faces)
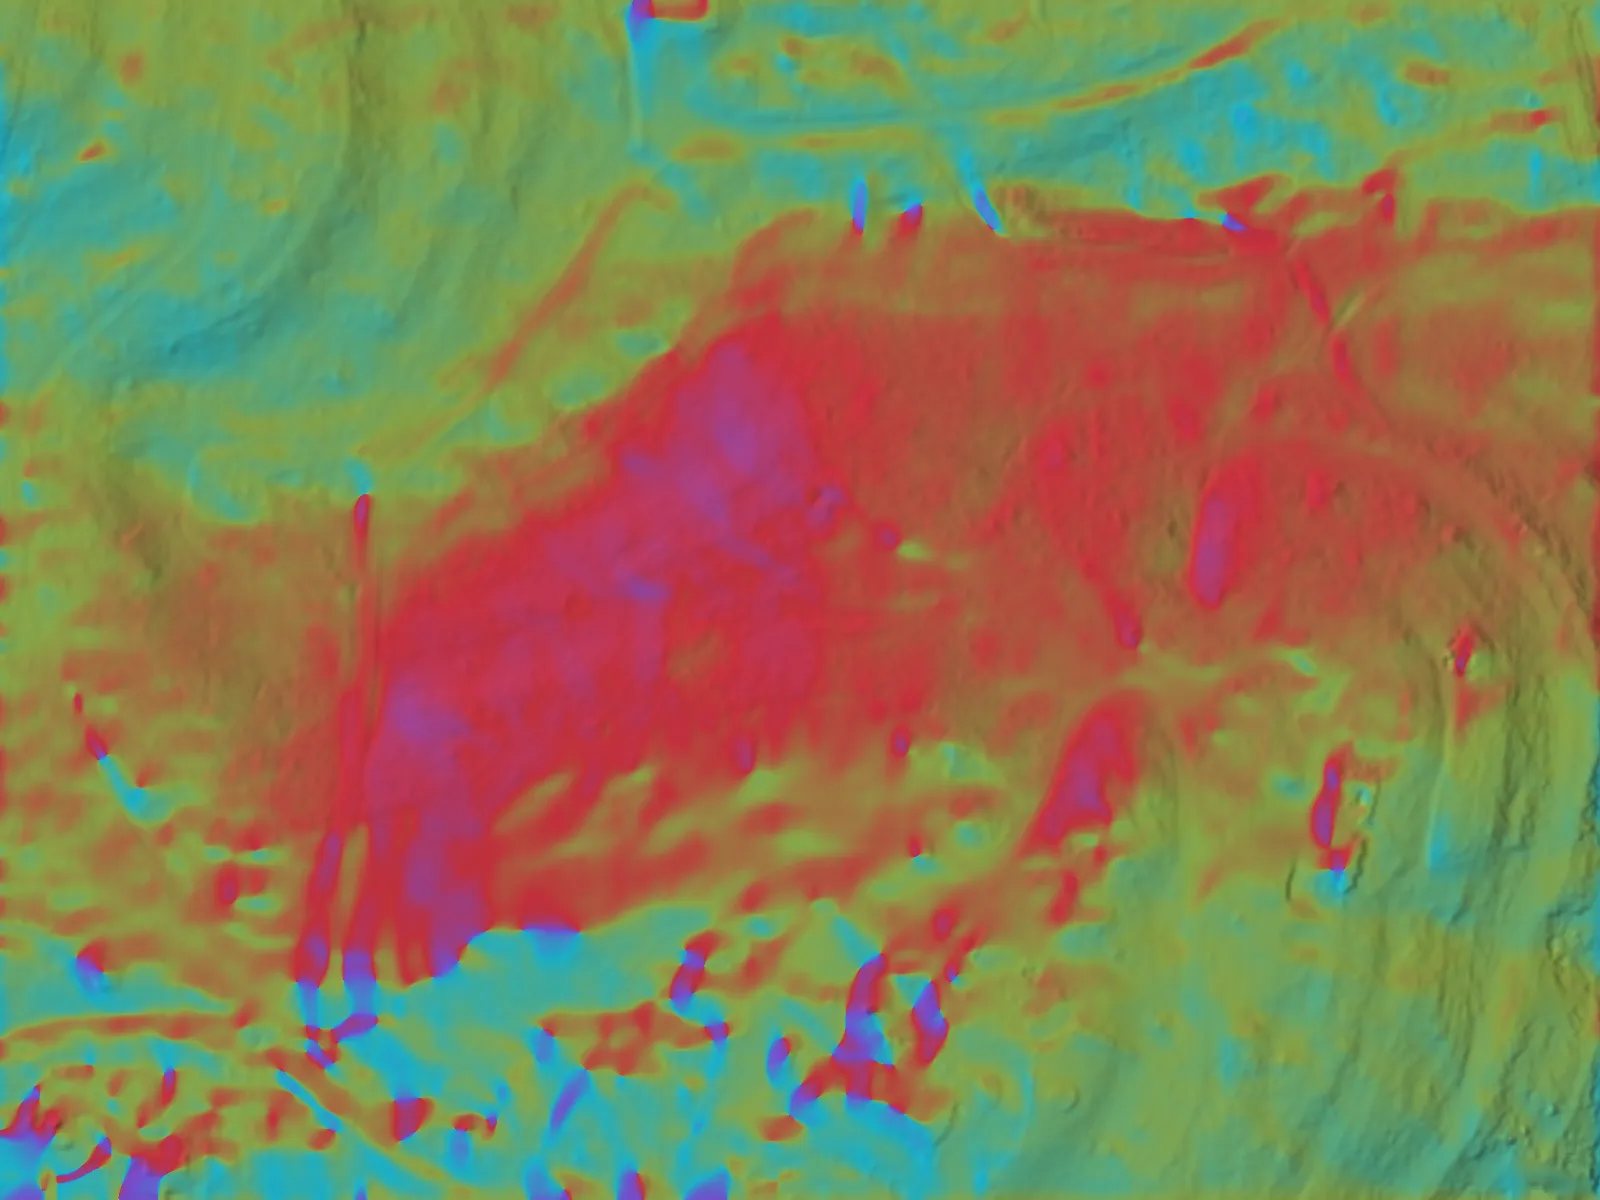
What it is: a map of the compass direction each slope faces — north, east, south, west. It answers "which way does this hillside look?"
When to use it: anything sun- or wind-driven. South- and west-facing slopes bake in the Texas sun (drier soils, more heat load); north-facing slopes hold moisture and shade. Aspect informs where to place solar, how to orient buildings and vegetation, and where snow-melt or frost lingers.
Contours (lines of equal elevation)
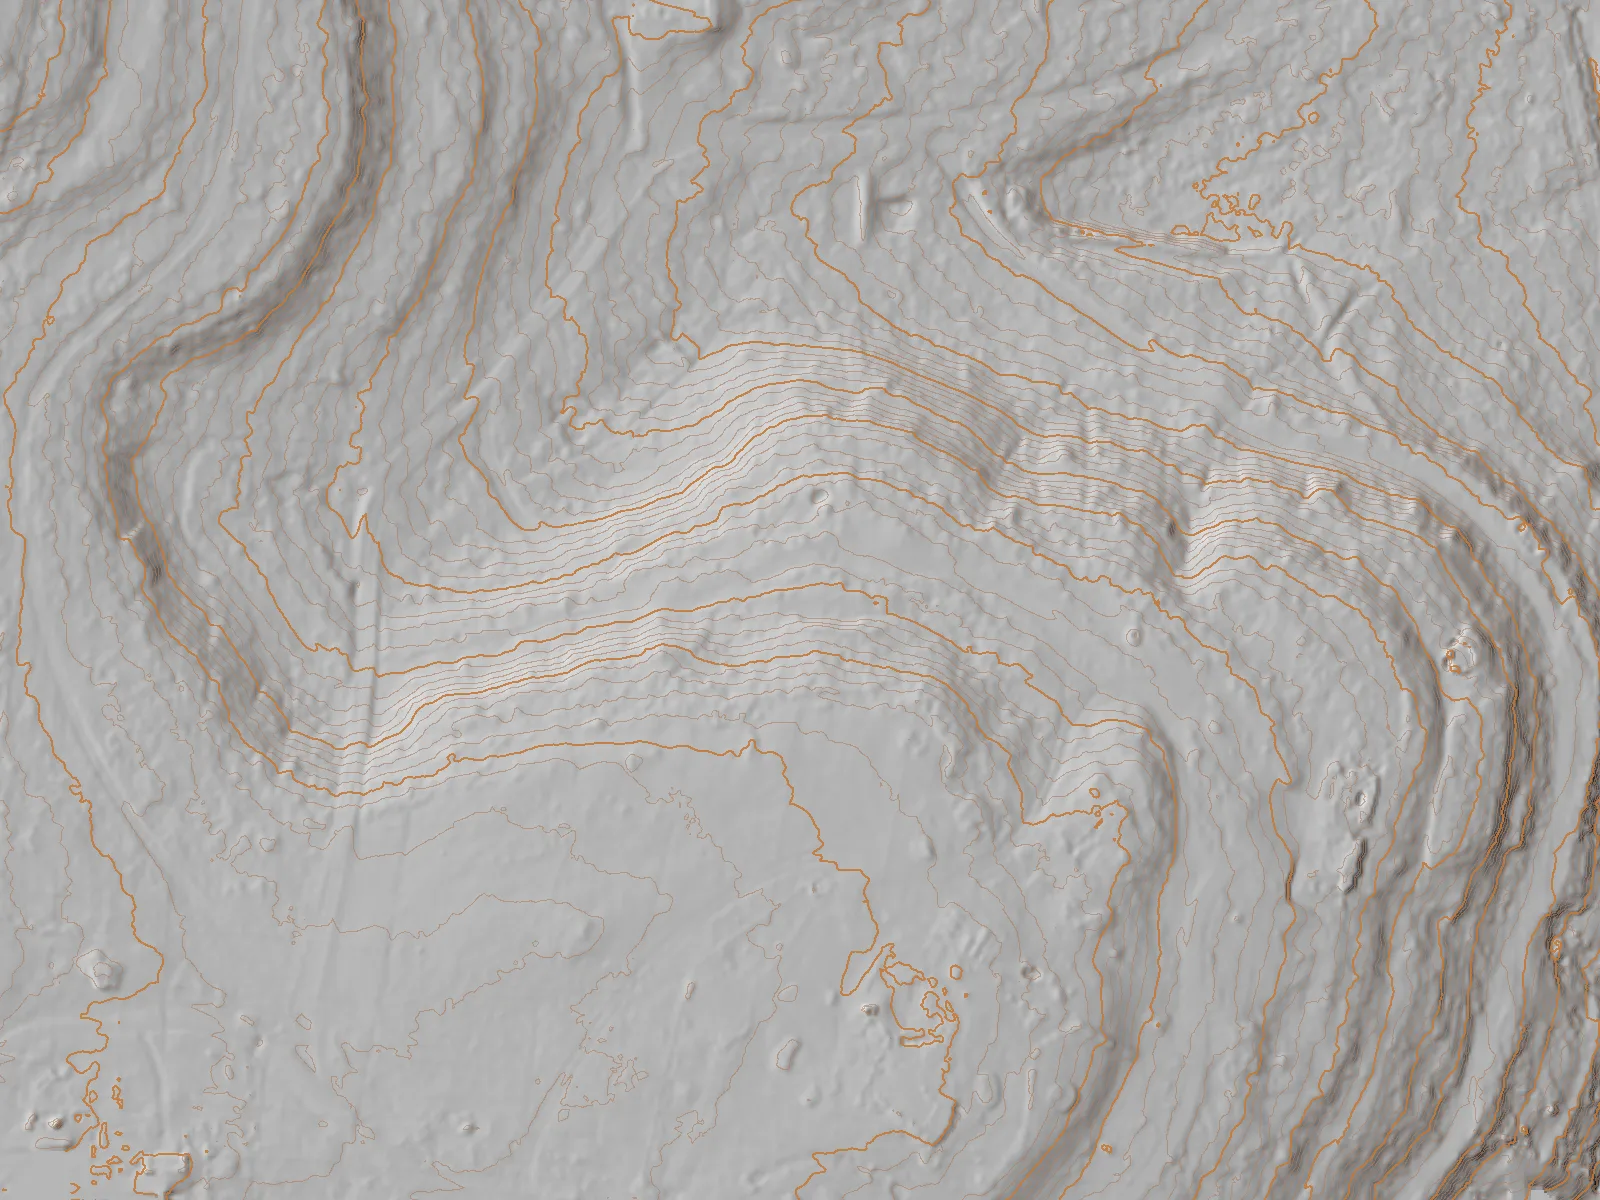
What it is: the familiar topographic contour lines — each line traces a constant elevation, so tightly-spaced lines mean steep ground and widely-spaced lines mean flat. We can set the contour interval (say 1-ft or 2-ft) and emphasize a bold "index" line every few contours.
When to use it: design and CAD hand-off. Contours are the language civil engineers, architects, and site designers already work in. Your contours export as DXF and drop straight into AutoCAD or Civil 3D in the project's coordinate system (see Your Coordinate System, Explained Simply). This is the layer that turns a picture into something a design team can build from.
How they work together
You rarely use just one. A typical read: start on hillshade to understand the terrain, switch to slope to find the buildable ground, check aspect for sun and drainage exposure, then pull contours for the design set. Add the drainage layers (next guide) and you can see not just the shape of the land but where the water goes across it. For the full drainage-and-flood story, see our Land & Hydrology Analysis page.
The honest limit
Drainage, flow, terrain, and floodplain layers are derived analysis computed from our elevation data to support planning and design. They are not a certified survey, a stamped engineering study, or a FEMA flood-zone determination. They're precise mapping — excellent for understanding your land and handing to your design team — but Embry Solutions does not perform land surveys. For boundary or title work, consult a licensed Texas surveyor.
Related guides
Where the Water Goes: Drainage, Flow & Wetness (TWI)
Flow accumulation, the Strahler drainage network, and the Topographic Wetness Index in plain English — how we model where water collects, channels, and lingers on your property from the shape of the ground.
Seeing Under the Cedar: Canopy Height (CHM) & Bare Earth
How a LiDAR scan sees the real ground beneath brush and cedar — the difference between the top surface (DSM) and bare earth (DTM), and the Canopy Height Model (CHM) that measures the vegetation in between.
Measure stockpile & earthwork volumes
Use the Volume Calculator to get real cut/fill volumes from your elevation data — pick a base level, read cut, fill, and net, and compare two scans over time.
Your Coordinate System, Explained Simply (WGS 84 / UTM Zone 14N)
What that 'WGS 84 / UTM Zone 14N' label on your data actually means, why it matters when you hand files to an engineer or GIS team, and why you can safely ignore it if you're just exploring the map.
Didn't find your answer? Contact us and we'll help you out.